Friday, December 15, 2023

How to write a good User Story?

Until User Stories came into existence, requirements, in my opinion hardly spoke about the person who needs it or why the person needs it. It was impersonal.

The good thing about Agile User Story is that it tells who wants it - is it an Admin who needs it? is it a data operator who needs it? And it also tells why it is required. That is the key - The 'why' gives the developer or a tester the 'value' or the importance of doing that story.

Scrum is all about delivering value. The user story should talk about it. How else can the person developing or testing it will get a sense of importance of the work he/she is doing?

User story should tell us the below details:

  • Who wants? The Persona
  • What do they want? The task to be done
  • Why they want? The value
  • And then how do I test and Accept that its done, once the story is completed?

That is all that is required in a Story!

Eg:

As a shopper, I want to be able to search for any product and also be able to apply filters, so that I can find the specific items that I am looking for.

Acceptance Criteria:

1. Search button and search text box should be visible clearly. 

2. User should be able to enter the data in search box

3. Filters should include options for Prize, Size, Color

4. On clicking the apply filter, search results should change appropriately

Now a good Story should also follow the INVEST principle.

I - Independent - It can be independently shipped to Production.

N - Negotiable - A story is not a signed contract. Its subjected to change. It should be flexible. In the above example, if we need to add another filter, we can/should be able to do it.

V - Valuable - It should have a purpose

E - Estimable - We should be able to give an estimate

S - Simple 

T - Testable - Able to test and accept its completion

Saturday, December 9, 2023

Some Important Cost Metrics

When it comes to cost analysis, the below formula and examples would be very helpful.

Scenario: My budget is Rs 1000. Project schedule = 4 weeks of which 3 weeks are completed.

Earned Value:

This is the value of work that is already completed. Assume that 70% of the work only is completed.

Formula: EV = % Work done * Budget

In the above eg: 70/100 * 1000 = Rs 700

This is a very critical value. How do I find how much of work is completed in various Software life cycle phases? Here is an example. Assume that we have 5 requirements, of which 2 are simple (estimated design time is 3 days each), 2 are medium (estimated design time is 5 days each) and 1 complex (estimated time is 10 days). Total estimated time to complete design work = 26 person days.

  1. Design Phase Earned Value Scenario 1: If 2 medium and 1 simple are completed, then 13/26 is completed (ie) 50% is completed.  
  2. Design Phase EV Scenario 2: If 2 simple and 1 medium are fully completed and the complex is 'In Progress' and the other medium is yet to be started, then the amount of work completed can be calculated based on the below:
    1. Based on the break down of the complex requirements' design into UI design, backend architecture, API endpoints or db schema etc., and the work completed in each of these items, we can give an approximate work completed. Although it may not be accurate, this approach will help to give us an idea of work completion to a very good extent. So in this example, if we have UI design and db design each spanning 3 days and the backend requires 4 days, if UI alone is completed, we can say that 3/10 is completed. Therefore total work completed in this scenario = 3 + (3*2) + 5 = 14/26
Test case execution earned value is direct, as we would know the total number of test cases to be tested and the number already executed/tested. 
On the other hand, for test cases write up work, based on the number of the test scenarios completed for each functionality we can give the work completed details.
_______________________________________________________________
Planned Value:
This is the value of work that we planned to complete by that time. Eg: We want to complete 75% of work by end of 3rd week in a project spanning 4 weeks.

Formula: PV = % Planned work completion * Budget

In our example: PV = 75 * 1000 = Rs 750

_______________________________________________________________
Schedule Variance:

Formula: EV - PV 
In our example: 700 - 750 = -50 (Which means we are behind the schedule)

Schedule Performance Index (SPI):
Formula: EV / PV
In our example: 700/750 = 0.93 (A value < 1 implies that we are behind the schedule)

_______________________________________________________________
Actual Cost:

This gives the actual amount spent until that point of time. Eg in our case, what is the actual cost that is spent until 3rd week?

Formula: Effort per hours * Total number of hours.

Lets assume that in our example, for doing the 70% of the work the team had spent 30 hrs and each hr is charged at Rs 30.
Therefore Actual Cost in our case = 30 * 30 = Rs 900

_______________________________________________________________
Cost Variance:
Formula: EV - AC 

The cost variance gives us an idea of how much we have spent to get a specific value for that expenditure. In our example, we have spent Rs 900, but we have got the product output of worth Rs 700 only.
Hence, CV = 700 - 900 = Rs -200. This shows that we are Rs 200 behind the budget.

_______________________________________________________________
Cost Performance Index:
Formula = EV/AC 
In our example: CPI = 700/900 = ~ 0.8 (A value < 1, implies that we are over the budget!)

_______________________________________________________________
Estimation At Completion (EAC):
So far we have got an idea of how much value of product we have earned, the cost that we have paid and the planned value of product we should have earned. We also saw that in our example, we are over the budget, unfortunately. So if the project goes at this rate, what would the budget that would be required to bring it to completion? That is called EAC.

Formula: EAC = Budget / CPI

In our example: EAC = 1000/0.8 = Rs 1250. 
Hence by end of the project we would need Rs 250 extra. 
This gives an idea for the management to decide how much extra funding they need to arrange or assess how to reduce the overshoot etc. EAC becomes a very important metric to take decisions with respect to budget.

_______________________________________________________________
###############################################################

Saturday, December 2, 2023

Context Switching

 One of the metrics that a Scrum Master need to look out for is the "Velocity" - where the metric should be calculated in terms of both story points as well as number of stories.

Why is that so? Isn't tracking velocity at story points not sufficient?

Let us take the below scenario:

Team A has the below velocity: Story points = 70 and # Stories = 9 

If they want to set the velocity for the upcoming sprint as 70 points and yet deliver it with a number of shorter stories (eg: 20 stories), is that fine?

Although this appears to be devoid of risks, the team should keep in mind, what is known as context switching. 

What is Context Switching:

It is the time lost (i.e) productivity loss when we switch over from Task 1 to Task 2 and back to Task 1. It is estimated to be 20%. So in order to resume Task 1, due to the switch over, there is a time loss to get back to its context.

There have been many studies in this area, and the out come strongly points to the fact that context switching increases wastage. Computer scientist 'George Weinburg' gathered data around this and published the below details.


As we can see, the more multitasking is involved, greater the context switching and the loss %. As a Scrum Master, it is therefore necessary to consider velocity at both # of Story Points and at # of Stories level.

################################################################

Monday, November 20, 2023

Key Quality Metrics

 In this blog we will discuss some of the key Quality Metrics.


Metric Definition
Defect Leakage

It is the number of defects that is found by customers and NOT by the project team.

Ideally it should be < 10%, however teams can strive for 5% or less as part of their optimizations.

Defect Injection Rate


The number of defects raised per day.

If the trend is such that the number of defects identified are more at the beginning and it gradually reduces towards the end, it means that the project is in good health wrt quality.


Defect Density


The number of defects found in say a million lines of code
Formula: Number of defects/LOC (in Million)


Code Coverage


The number of lines of code that the test case/suite covers as part of testing

Review Efficiency


The number of defects found during the review process. Either design review or code review etc
Eg: Say, we need to find the review efficiency for detailed design document review:
Formula = Number of defects found during DD review / (Number of defects found during DD review + Number of defects found in later stages of the project that has source as Detailed Design Phase)

The above formula can also be extrapolated to Testing to obtain Test Efficiency.
Eg: Test Efficiency for System Testing Phase = Number of Defects found in ST Phase / (Number of defects found in ST + SIT + UAT)

Defect Removal Efficiency

The number of defects resolved by the Dev team/Total number of defects raised.    

Thursday, November 16, 2023

Persuasion And Negotiation Techniques

 AS a Program Manager, one of the key task that we need to do is Stakeholder negotiation/persuasion. Not just Pgm Managers, colleagues in Sales can also be benefitted by this technique.

A couple of Techniques are discussed here.

  1. Aristotle's Rhetoric
  2. SPIN Technique


Aristotle's Rhetoric:

The study of persuasion began with the Greeks. They believed that rhetoric was very critical for a successful politician. A good rhetoric should be able to talk on both sides (which demonstrates that he/she knows the whole problem). It is also a great form of teaching. According to Aristotle there are 3 pillars that constitutes persuasion. They are:

  1. Ethos (Credibility) - Increase the trust quotient with the help of your rank in the hierarchy, your knowledge in that area, your established relation in that group, any common ground between the listener and negotiator. (What do they share in common - their view points, beliefs etc)
  2. Logos (Logic) - This should contain the facts of the argument. Any data, statistics, evidences, examples etc can be used as part of logos.
  3. Pathos (Empathy) - Understanding the pain/concern and then emotionally connect - body language, tone etc

Persuasion is an art and understanding the pillars of it will help us carry the load of stakeholder management with ease, comfort and confidence.


SPIN Technique:

The below image from https://www.linkedin.com/pulse/spin-selling-techniques-sabyasachi-chakraborty/ will help us understand the SPIN technique very well.


Agile Best Practices

In this blog, I have tried to list down some of the Agile Best Practices that I had learnt in my experience.

Give sufficient time for grooming and estimation:

In my experience, especially with teams that are recently adapted to agile, it is very challenging for them to give an estimate during the 'Planning Poker' game. When I started a 'Pre Grooming' meeting, where the stories were discussed in detail and then gave a day's time for the team members to think about the estimation, the 'Grooming' meeting (now essentially an estimation meeting :)) became more meaningful 


Consider having product backlog refined upto atleast Sprint n+2:

The Product Owner must ensure he/she has the product backlog refined (stack ranked for the next 2 or 3 upcoming sprints). This helps the team to pick up the next stack ranked PBI even if the PO is unavailable due to sickness.


Calculate velocity as both Number of Storypoints and Number of Stories:

It is a good practice to note both the above metrics and follow the trend as your prediction for the upcoming sprint. The reason being, it gives a better predictability. How so?

For eg: Team 'A', who have just closed Sprint 'n' has a velocity with Sp = 40 and number of stories = 8. Sprint n+1, they choose 42 sp but the number of stories = 21. Is there a problem? The 40 sp are generated by Team A when they choose around 8 stories. Now if it gets tripled, chances are they would not meet 40 sp, because there is a heavy context switching associated with multiple stories, that would impact productivity of the team.


Calculate 'Value' delivered as a KPI:

While velocity as sp/stories, defect leakage, test coverage etc are good, scrum is all about delivering value. One of the six principles of scrum states 'Value based prioritization'. Therefore, we must consider measuring value delivered as a key metric. That's a good agile practice. How do we do that? Add the value for each story (ie) we would anyway stack rank the stories. To begin with add metric values like 10 for high value, 6 for medium and 3 for low value stories and mark the value for each story in the sprint. Measure it - we can do that easily through a Sprint Burn up chart. Track the value delivered sprint after sprint.


Remote Worker Engagement:

  • Record Spring plan and review meetings (esp in case of scrum of scrum) and post the link in a common repository. That will help all team members to have an excellent point of reference.
  • Have centralized status wikis that will pull the data from JIRA and present the details to all team members. Charts/2 D tables like Assignee Vs Defects, gives a view of all defects that are with that assignee. 
  • Centralized wikis with 'Current Sprint+1' and 'Current Sprint + 2' backlog also will give an understanding of the upcoming work to the team members
  • Conducting 'All Hands' once a month by the Leadership Team will ensure to bring the remote workers to the same platform and it is a great forum to understand program/portfolio/company level strategies, initiatives etc
  • People Manager must have a monthly 1:1 with remote worker, if possible in a video call. This will help to increase the trust and there by team bonding.


Produce Matrix/Mapping where applicable:

If there are a number of permutations and combinations that should be tested (for eg), then if its applicable, we should try to create a matrix, that will help easier validation. Sample matrix/mapping that was created for UI validations.


Monday, November 13, 2023

Matrices Used in Program Management

There are multiple matrices that are used across programs that helps Program Managers assess the health of the program. In this blog, I have tried to capture various matrices that Pgm Managers use and a basic explanation and purpose of the same.

In this blog I have covered:

  1. Risk Matrix
  2. Stakeholder Interest Matrix
  3. Work Prioritization Matrix
  4. Stakeholder Expectation/Requirement Prioritization Matrix
  5. Requirement Traceability Matrix
  6. SWOT Analysis Matrix
  7. Dependency Structure Matrix
  8. RACI


Risk Matrix

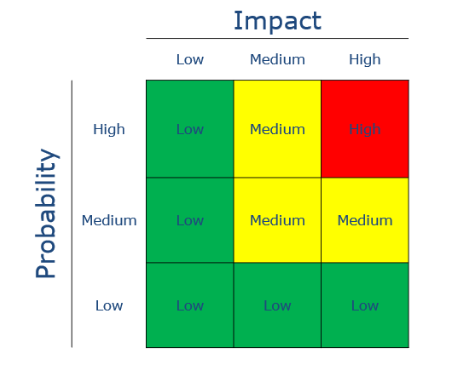
This matrix helps to find the qualitative assessment of a risk. Based on this, the risk should be treated.


How to treat them?

If your risk falls on the green box, you can Accept the risk as the repercussions expected will be minimal.

If your risk falls on the red box, you can transfer the risk or avoid it 

If your risk falls on the yellow box, you can mitigate it (ie lower the impact or probability or both)


Stakeholder Matrix

This matrix helps us to understand where each Stakeholders are in the matrix. Based on their position in the matrix, we need to engage them appropriately.


This is an extremely useful matrix which helps the Program Manager to decide the level of communication required for each stakeholder.
Manage Closely: Mostly this will be the owner of the entire program. Has high stakes. Naturally Pgm Mgr has to manage him/her closely
Monitor: Most likely to be a sub contractor (non employee) whose involvement in the program would be for a limited time.
Keep Satisfied: This is most likely to be the executives or the program sponsors. Definitely they need to be satisfied with the program progress
Keep Informed: These are most likely to be architects or SMEs or ICs who has a lot of influence, but may have lesser influence on non technical decisions.

Work Prioritization Matrix

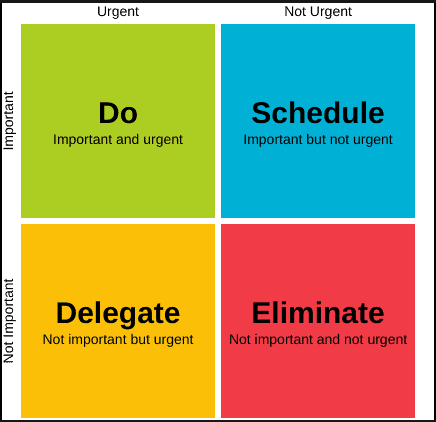
When we have conflicting priorities from multiple projects / multiple tasks, the below matrix will help us place the tasks in the appropriate division in the matrix, there by helping us to understand how to deal with those tasks.


Stakeholder Expectation/Requirement Prioritization Matrix

It is very common for Stakeholders/customers to come up with multiple requirements in a program. However based on the program goals and objectives, program managers should identify, in which of the below box, does the need of the stakeholder fall into. That will help the Pgm Manager to negotiate and also have a good and transparent relation with the stakeholder


Requirement Traceability Matrix

This matrix helps to trace, check and validate if all requirements are delivered. The requirement flows through multiple project phases - such as impact analysis, design, coding, testing. This matrix traces the requirement across all these phases to the final deliverable.
Why is this important:
1. Every requirement is mapped to the final deliverable. So it is easier to track the scope and completion.
2. When there is a future change in the requirement, the RTVM helps us to get all the records required from analysis to testing. Future changes are easier to implement.
3. Dependency between requirements can also be easily found using RTVM. If Req x is removed, the list of reqs that depend on Req X will also be impacted. These details can be found using RTVM.

Here is a sample RTVM. As you can see, the requirement is traced until Test. You can add impact analysis document, test case results too in the below.


SWOT Analysis Matrix

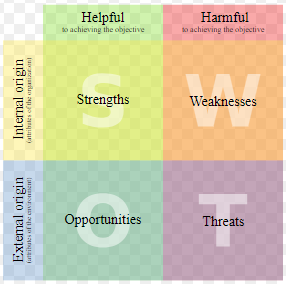
This is used to evaluate a company's position in the market to know where are positioned amongst its competitors. This can be used by company to come up with a strategy to improve their position in the market.
It can also be used by a person to understand his/her strengths and weakness


Dependency Structure Matrix

The dependency matrix is very useful to find dependencies across requirements or even stakeholder dependencies. For eg., in a task dependency matrix, both the rows and columns are tasks. Tasks in the rows are tasks that have dependencies on the tasks in the column
In a very large program, this becomes very useful in scheduling the tasks and also risk of the tasks due to the dependencies.


RACI Matrix

The RACI matrix is helpful to decide the ownership and the separation of the duty for each task.

Accountable - Should be one person, who will take decisions, sign off on the task etc
Responsible - The person or persons doing the task
Consulted - The person who is generally consulted before beginning or before sign off of the task
Informed - Keep the person in loop on the progress of the task.